
Underestimating your on-ground workforce leads to 45-minute registration queues, frustrated VIP delegates, and critical security vulnerabilities. Overestimating inflates labor costs, erodes margins, and clutters aisles with idle personnel.
Achieving balanced operational efficiency requires shifting away from guesswork and adopting a structured staffing ratio calculator framework.
Staff-to-guest ratios depend on operational zones, attendee arrival curves, service intensity, and layout complexities across corporate conventions, exhibitions, and social galas. This guide outlines zone-by-zone mathematical formulas, industry benchmark tables, and budgeting templates to help you calculate on-ground headcount.
Table of Contents
- The Mathematical Core of Event Staffing
- Zone-by-Zone Staffing Ratios & Formulas
- Master Event Staffing Ratio Matrix
- Step-by-Step Headcount Calculation Model
- Interactive Headcount & Budget Calculator
- Critical Adjustment Factors That Alter Ratios
- Frequently Asked Questions (FAQs)
1. The Mathematical Core of Event Staffing
Calculating event headcount does not rely on a single, universal staff-to-attendee ratio. Instead, workforce planning uses a modular formula based on throughput velocity, fixed physical posts, supervisory spans of control, and operational relief buffers.
TotalHeadcount=(ThroughputRoles)+(FixedPosts)+SupervisoryTier+ReliefBuffer
- Throughput Roles: Variable stations driven by arrival rate (e.g., registration check-in, baggage scanners, beverage bars).
- Fixed Posts: Fixed locations requiring continuous coverage regardless of guest volume (e.g., green-room doors, emergency exits, stage wings).
- Supervisory Tier: Team leads allocated according to span-of-control ratios.
- Relief & Rest Buffer: 10% to 15% surplus staffing to accommodate mandatory meal breaks, rotations, and sudden absenteeism.
2. Zone-by-Zone Staffing Ratios & Formulas
Zone A: Registration, Badging & Check-In
Registration desks create the attendee’s first impression. Bottlenecks occur when arrival concentration collides with manual badge processing.
RegistrationStaff=PeakHourlyArrivalsTransactionTime(inminutes)60
- Digital Pre-Registered (QR Code / RFID Scan): 1 staff per 75–100 expected arrivals per hour (Avg. transaction: 25–35 seconds).
- On-Site Manual Registration & Payment: 1 staff per 30–40 expected arrivals per hour (Avg. transaction: 90–120 seconds).
- Line / Queue Marshals: 1 marshal per 3 active check-in counters during peak morning surges.
Zone B: Front-of-House Ushers & Hall Seating
- Tier 1 (Plenary / Keynote Auditoriums): 1 usher per 50–75 seats. Responsibilities include aisle clearance, seating guidance, and mic running.
- Tier 2 (Breakout Seminar Rooms): 1 room attendant per active hall (up to 100 capacity) for door control, speaker water replenishment, and AV handoffs.
- VIP / Executive Lounges: 1 dedicated host/usher per 15–20 VIP delegates for personalized hospitality.
Zone C: Exhibition Floors & Trade Stalls
- Booth Promoters / Product Specialists: 1 promoter per 10–15 sqm of active stall space (ensures comprehensive visitor engagement without cluttering the booth).
- Information Desks / Help Centers: 2 attendants per centralized desk for every 500 concurrent exhibition visitors.
Zone D: Hospitality & Banqueting Services
- Plated Formal Dinners: 1 server per 10–12 guests (standard corporate gala) or 1 per 6–8 guests (high-end VIP synchronised service).
- Buffet Dining: 1 server per 20–30 guests (plate clearing, chaffing dish refills, and line management).
- Bar Service (Full Spirits Bar): 1 bartender per 35–50 guests + 1 barback per 2 active bartenders.
- Beer & Wine Only: 1 bartender per 50–75 guests.
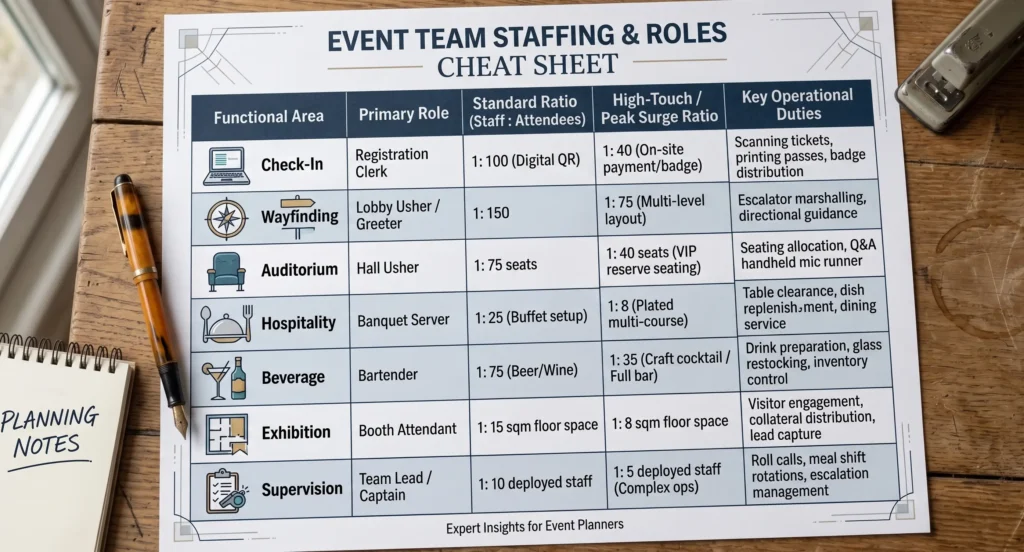
3. Master Event Staffing Ratio Matrix
This reference matrix summarizes standard industry benchmarks across primary event verticals:
4. Step-by-Step Headcount Calculation Model
Worked Scenario: 600-Attendee B2B Corporate Summit
- Format: 1 Plenary Hall (600 capacity), 2 Breakout Rooms (150 capacity each), Buffet Lunch, Full Evening Reception.
- Peak Check-in Window: 75% of guests (450 people) arrive within a 45-minute window. Digital QR badges utilized.
1. REGISTRATION DESK:
– Peak throughput rate = 450 guests ÷ 45 min = 10 guests/min
– Average transaction time = 30 seconds (0.5 min)
– Active counters needed = 10 × 0.5 = 5 staff
– Queue Marshals = 2 staff
– Subtotal = 7 Staff
2. AUDITORIUM & BREAKOUTS:
– Main Plenary (600 seats @ 1:75 ratio) = 8 Ushers
– Breakout Rooms (2 halls @ 1 attendant/room) = 2 Attendants
– VIP Green Room Coordinator = 1 Host
– Subtotal = 11 Staff
3. HOSPITALITY (Buffet Lunch & Reception):
– Lunch Buffet (600 guests @ 1:25 ratio) = 24 Servers
– Evening Cocktail Bar (600 guests @ 1:50 ratio) = 12 Bartenders/Barbacks
– Subtotal = 36 Staff (staggered shifts)
4. SUPERVISORY TIER & RELIEF:
– Direct Front-of-House Staff = 18 (7 Reg + 11 Hall)
– Supervisors (1:10 ratio) = 2 Leads
– Relief Buffer (15% across core operations) = 3 Floaters
– Subtotal = 5 Staff
TOTAL BASE WORKFORCE: 23 FOH Core Staff + 36 Catering Crew = 59 Personnel
5. Interactive Headcount & Budget Calculator
Use the dynamic calculator below to model your staffing numbers, adjust service tiers, and generate estimated workforce costs in real time.
6. Critical Adjustment Factors That Alter Ratios
Ratios are baseline assumptions. Adjust your final calculations based on these operational variables:
- Multi-Level Venue Architecture: Venues split across multiple floors, wings, or outdoor-to-indoor transitions require an additional 15% to 20% in wayfinding ushers to guide delegates across blind corridors.
- Alcohol Service Intensity: Serving custom cocktails or open bars increases bar staffing requirements by 40% compared to basic beer and wine stations due to drink preparation times.
- VIP & High-Net-Worth Delegation Density: Events with high VIP concentrations require dedicated 1:1 or 1:2 escort hosts to manage executive green rooms, stage handoffs, and reserved seating.
- Hardware & Badge Printing Technology: On-demand badge printing (with photo capture or lamination) increases transaction times to 60–90 seconds per guest, requiring you to double check-in lanes compared to pre-printed badge pickup systems.
- Shift Length & Overtime Regulations: Shifts exceeding 9 to 10 hours require structured shift rotations or a planned relief crew (15% floaters) to prevent fatigue at frontline service desks.
7. Frequently Asked Questions (FAQs)
What is the standard staff-to-attendee ratio for a corporate conference?
A typical corporate conference requires approximately 1 operational staff member for every 40 to 50 attendees (excluding catering personnel). This includes registration clerks, wayfinding ushers, breakout room attendants, stagehands, and supervisors.
How do I calculate the number of registration counters needed?
Divide your total anticipated arrivals during the peak 45-minute window by the target transaction capacity of your check-in system. For digital QR scans (30-second average per guest), 1 staff member processes approximately 60 to 75 attendees per hour.
What is the ideal server ratio for a plated banquet vs. a buffet?
Plated dinners require 1 server for every 10 to 12 guests (or 1:6 for high-end synchronized dining). Buffet meal services require 1 server for every 20 to 30 guests to handle replenishment, table clearing, and line flow.
How many supervisors do I need on-site?
Standard span-of-control guidelines recommend 1 dedicated team supervisor for every 10 to 12 general event staff members. Large deployments spanning multiple disconnected zones should use a 1:8 ratio for effective oversight.
Plan Your Event Workforce with Precision
Avoid the risks of understaffed counters and unnecessary payroll overhead. For large corporate events, trade exhibitions, and brand launches across Delhi NCR, work with professional workforce teams equipped with verified headcount models and supervised on-ground execution.
Need an expert review of your event staffing ratio? Reach out to our operational planning team to validate your headcount requirements and receive a comprehensive workforce deployment plan.